Detroit Shock Fan Segmentation
Multi-page Power BI analytics for revenue, ticketing, and digital engagement insights
This project analyzes fan behavior using SQL-modeled data and Power BI dashboards to support segmentation, ticket revenue analysis, merchandising insights, and digital engagement strategy for a professional sports organization.
🎯 The Challenge
Sports organizations collect large volumes of fan data, but without structured segmentation and analysis, it can be difficult to understand who fans are, how they spend, and how they engage across channels. The goal was to transform disconnected datasets into actionable, stakeholder-ready insights.
🛠️ The Process
- Ingested fan, engagement, ticketing, and merchandise CSV datasets into SQL.
- Cleaned and transformed data using SQL and Power Query.
- Built fan-level segmentation logic using behavioral and demographic indicators.
- Created DAX measures to de-duplicate fans appearing in multiple segments.
- Designed a four-page Power BI dashboard for executive, revenue, and CRM stakeholders.
📊 Page 1 — Fan Segmentation Overview
This page provides a high-level snapshot of the fanbase, highlighting how fans are distributed across segments and demographic groups.
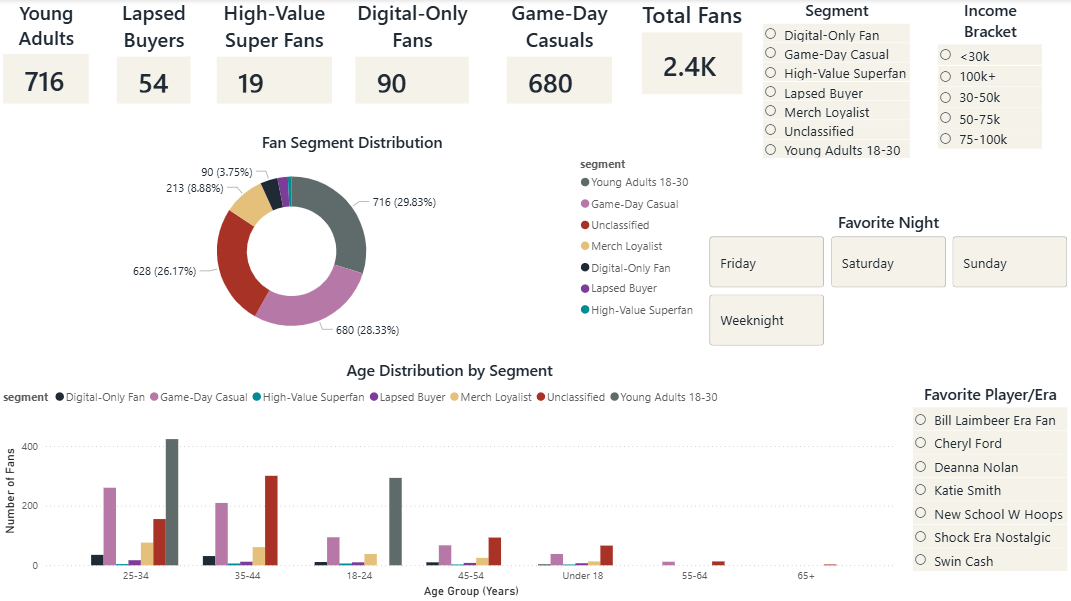
Fan Segmentation Overview — Executive-facing summary
Executive Takeaways
- The fanbase is primarily driven by Young Adults (18–30) and Game-Day Casuals.
- Age distribution skews heavily toward 18–44, indicating a digitally native audience base.
- A notable portion of fans remain unclassified, presenting an opportunity to refine segmentation.
📊 Page 2 — Ticket & Merch Behavior
This section examines how different fan segments behave financially, comparing average ticket spend, games attended, and merchandise purchases on a per-fan basis.
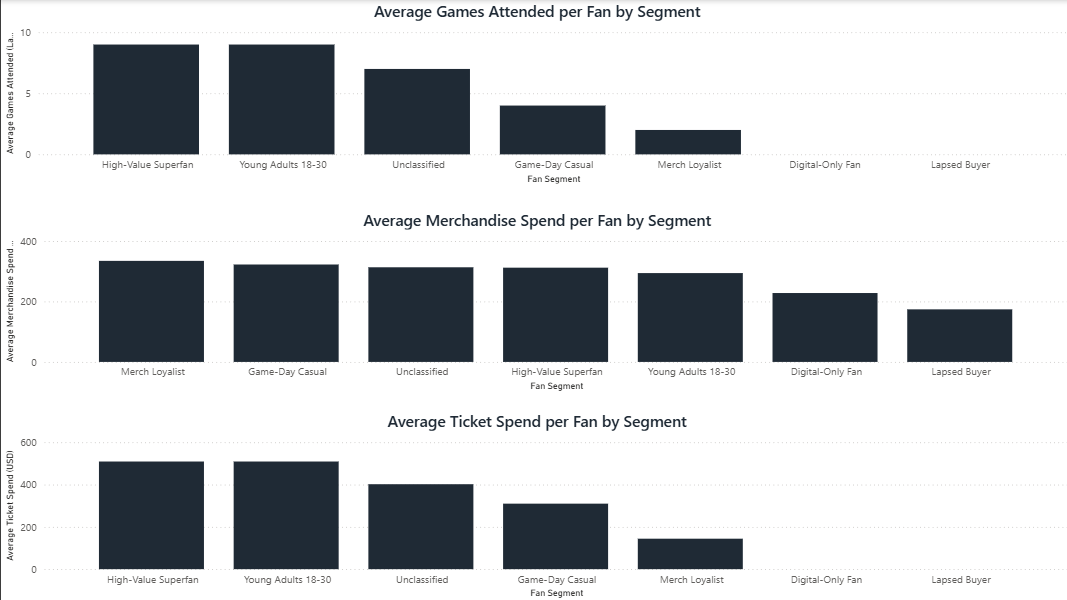
Ticket & merchandise behavior by fan segment
Executive Takeaways
- High-Value Superfans and Young Adults attend the most games on average.
- Merch Loyalists show the highest merchandise spend per fan despite lower attendance.
- Game-Day Casuals present strong upsell potential through bundled offers.
📊 Page 3 — Ticketing & Revenue Analysis
This page shifts to a revenue-focused perspective, showing how total ticket revenue, pricing behavior, and attendance depth vary across fan segments.
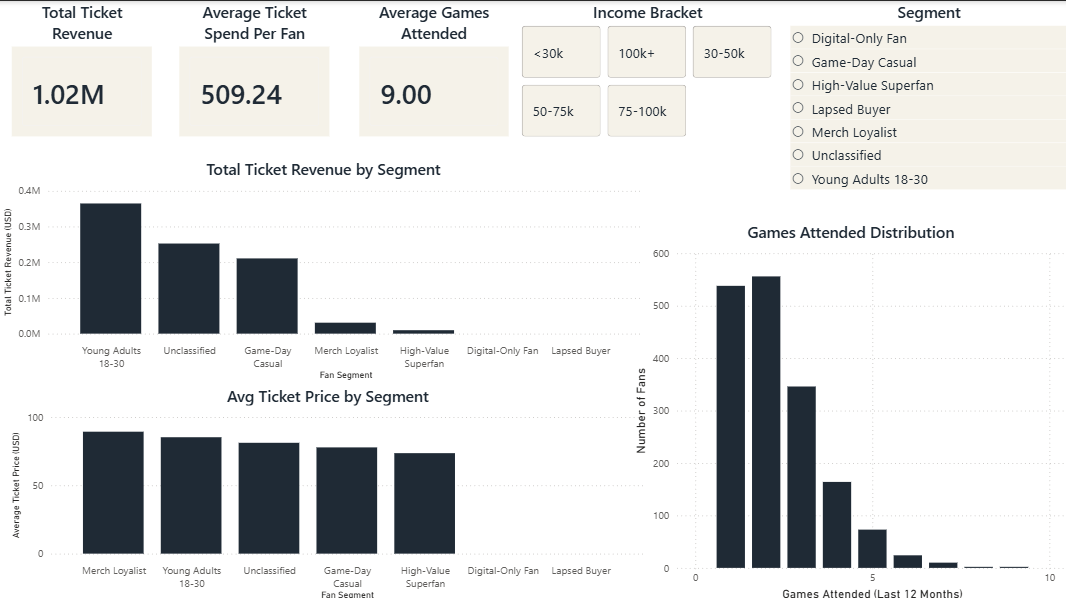
Total ticket revenue and pricing insights by segment
Executive Takeaways
- Young Adults and Game-Day Casuals generate the highest total ticket revenue.
- High-Value Superfans deliver the strongest per-fan ticket spend.
- Most fans attend only 1–3 games annually.
📊 Page 4 — Engagement & Digital Behavior
This page evaluates digital engagement, including email performance, app usage, and preferred communication channels.
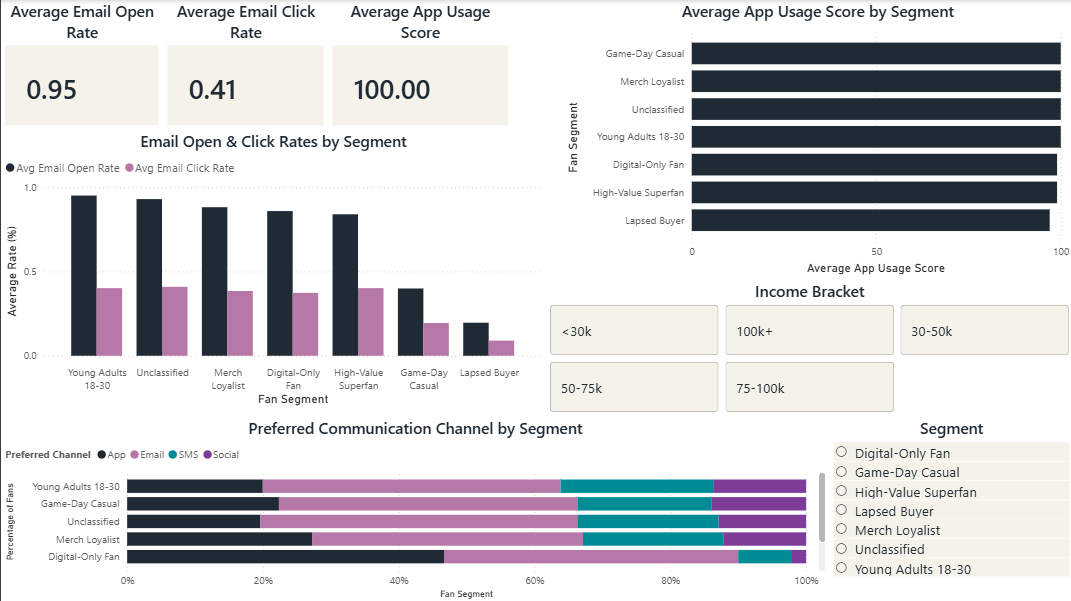
Digital engagement metrics and channel preferences by segment
Executive Takeaways
- Email engagement remains consistent across segments.
- Young Adults and Digital-Only Fans demonstrate stronger app usage.
- Channel preferences vary by segment, supporting targeted CRM strategies.
🧰 Tools Used
- SQL
- Power BI
- DAX
- Power Query
🔮 What I’d Do Next
Future enhancements could include campaign response tracking, churn-risk indicators, and personalized messaging integrations through CRM and marketing automation platforms.